
Post-acquisition Growth Assessment – Identifying Adjacent Growth Opportunities
As discussed in my previous blog, it has become increasingly important for buyout firms to actually add value to portfolio companies and significantly improve their revenue growth. The potential to generate new revenue growth is paramount as high valuations are making it more difficult to achieve an acceptable IRR target for the many new investments. Given that most revenue growth is generated by either expanding the company’s sales to current customers or growing outside of the current customer base into adjacent markets and/or geographies, it is important to have the necessary customer and market insight to develop a growth strategy that has a high likelihood of success.
As a follow-up to my last blog, “Growth with Current Customers”, I would like to explore how post acquisition research can identify the adjacent markets that are most attractive for delivering revenue growth.
Identifying the Most Attractive Adjacent Growth Opportunities
The overall assessment process is typically conducted using a phased approach, the first phase identifies and prioritizes potential growth markets based on the overall market attractiveness and best fit with current products/service offerings using pre-determined attractiveness and fit criteria. The second phase consists of a more in-depth analysis of the top identified target segments (usually 3-4) based on the overall fit and attractiveness scoring winners in phase 1.
The initial exercise in the market identification process is to determine the specific overall fit and attractiveness criteria to be used in determining the overall attractiveness of each of the specific market segments. Some questions to consider answering that would help in creating a solid list of fit and attractiveness criteria during this exercise, include:
- What characteristics do my most profitable customers have in common?
- In what areas does my company excel in terms of capability and/or performance?
- Where does my company have a difficult time competing?
- What limitations does my company have?
- Shipping radius, high cost position, service areas, etc.
- What advantages does my company have?
- Intellectual property, excellent design capabilities, low cost position, access to capital, etc.
By considering to these types of questions the team can begin to develop a relevant list of criteria to be used in scoring each potential market segment, ultimately determining its overall attractiveness. Although the attractiveness fit criteria will be different for every business, a sample list of possible criteria is shown below:
- Attractiveness
- Ability to add volume to current assets (increase capacity utilization)
- Overall size of the market segment
- Growth of market segment
- Ability to add value (measure of market commoditization)
- Competitive intensity,
- Proximity to plant (shipping radius)
- Amount of investment needed,
- Etc.
- Fit
- Matches material capabilities,
- Ability to leverage purchasing power (raw materials)
- Match with current market expertise
- Current customer overlap
- Process capability match,
- Ability to leverage intellectual property,
- Etc.
The next step in the process is the development of an initial list of potential adjacent markets. The list can be developed through multiple sources, to include: secondary research, personal experience, and discussions with internal resources, and interviews with industry experts. A reasonable number of initial potential markets from which to begin the narrowing process is 10 to 12.
Once the list of potential markets is complete, and the fit/attractiveness criteria has been finalized, the research can begin. The areas of focus for the market research within each potential market should be based on the fit/attractiveness criteria developed earlier. As the research is completed for each potential market, a score is developed for each of the fit/attractiveness criteria in each of the 10 -12 market segments, creating a prioritization matrix as shown in Figure 1 below.
Figure 1
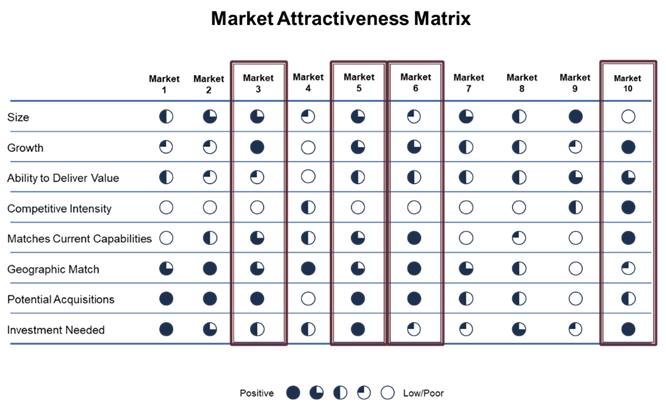
Once all of the criteria within the matrix have been given a fit and attractiveness score for each market, the most attractive markets can easily be identified. In the above chart, markets 3, 5, 6 and 10 have stand out as being the most attractive (highlighted in the above chart). Please note that actual numeric scores are typically used in calculating the overall attractiveness score for each market, and certain criteria can be weighted to provide more accurate scoring. Once completed, we recommend focusing on the top 3 to 4 markets for the next phase of research.
Qualification of the Most Attractive Market Opportunities
Since Phase I is a fairly “high level” assessment of overall market attractiveness, it is recommended that the information used in the initial scoring be re-affirmed in Phase II for the 3 to 4 markets identified in as most attractive to assure the initial scoring was reasonable, especially for the key criteria that carry the most weight if determining fit and attractiveness. If a changes in scoring is warranted based on new or additional information it is best to adjust the original scoring and see if it changes the overall attractiveness hierarchy established in Phase I. If a particular market needs to be added or deleted from the final list, make the appropriate adjustments and reprioritize the markets prior to conducting a “deeper dive” assessment of the top markets.
The more targeted “deep dive” should not only include additional web based research, but also in-depth interviews with industry experts and knowledgeable members of the value chain. The increased depth of knowledge relative to the most attractive markets will help validate the findings, provide additional insight needed to develop a market entry strategy, and provide the market information to set sales and revenue goals.
